Glyph-Based Multiscale Visualization of Turbulent Multi-Physics Statistics
Arisa Cowe, Tyson Neuroth, Qi Wu, Martin Rieth, Jacqueline Chen, Myoungkyu Lee, and Kwan-Liu Ma
ArXiv Preprint, 2025
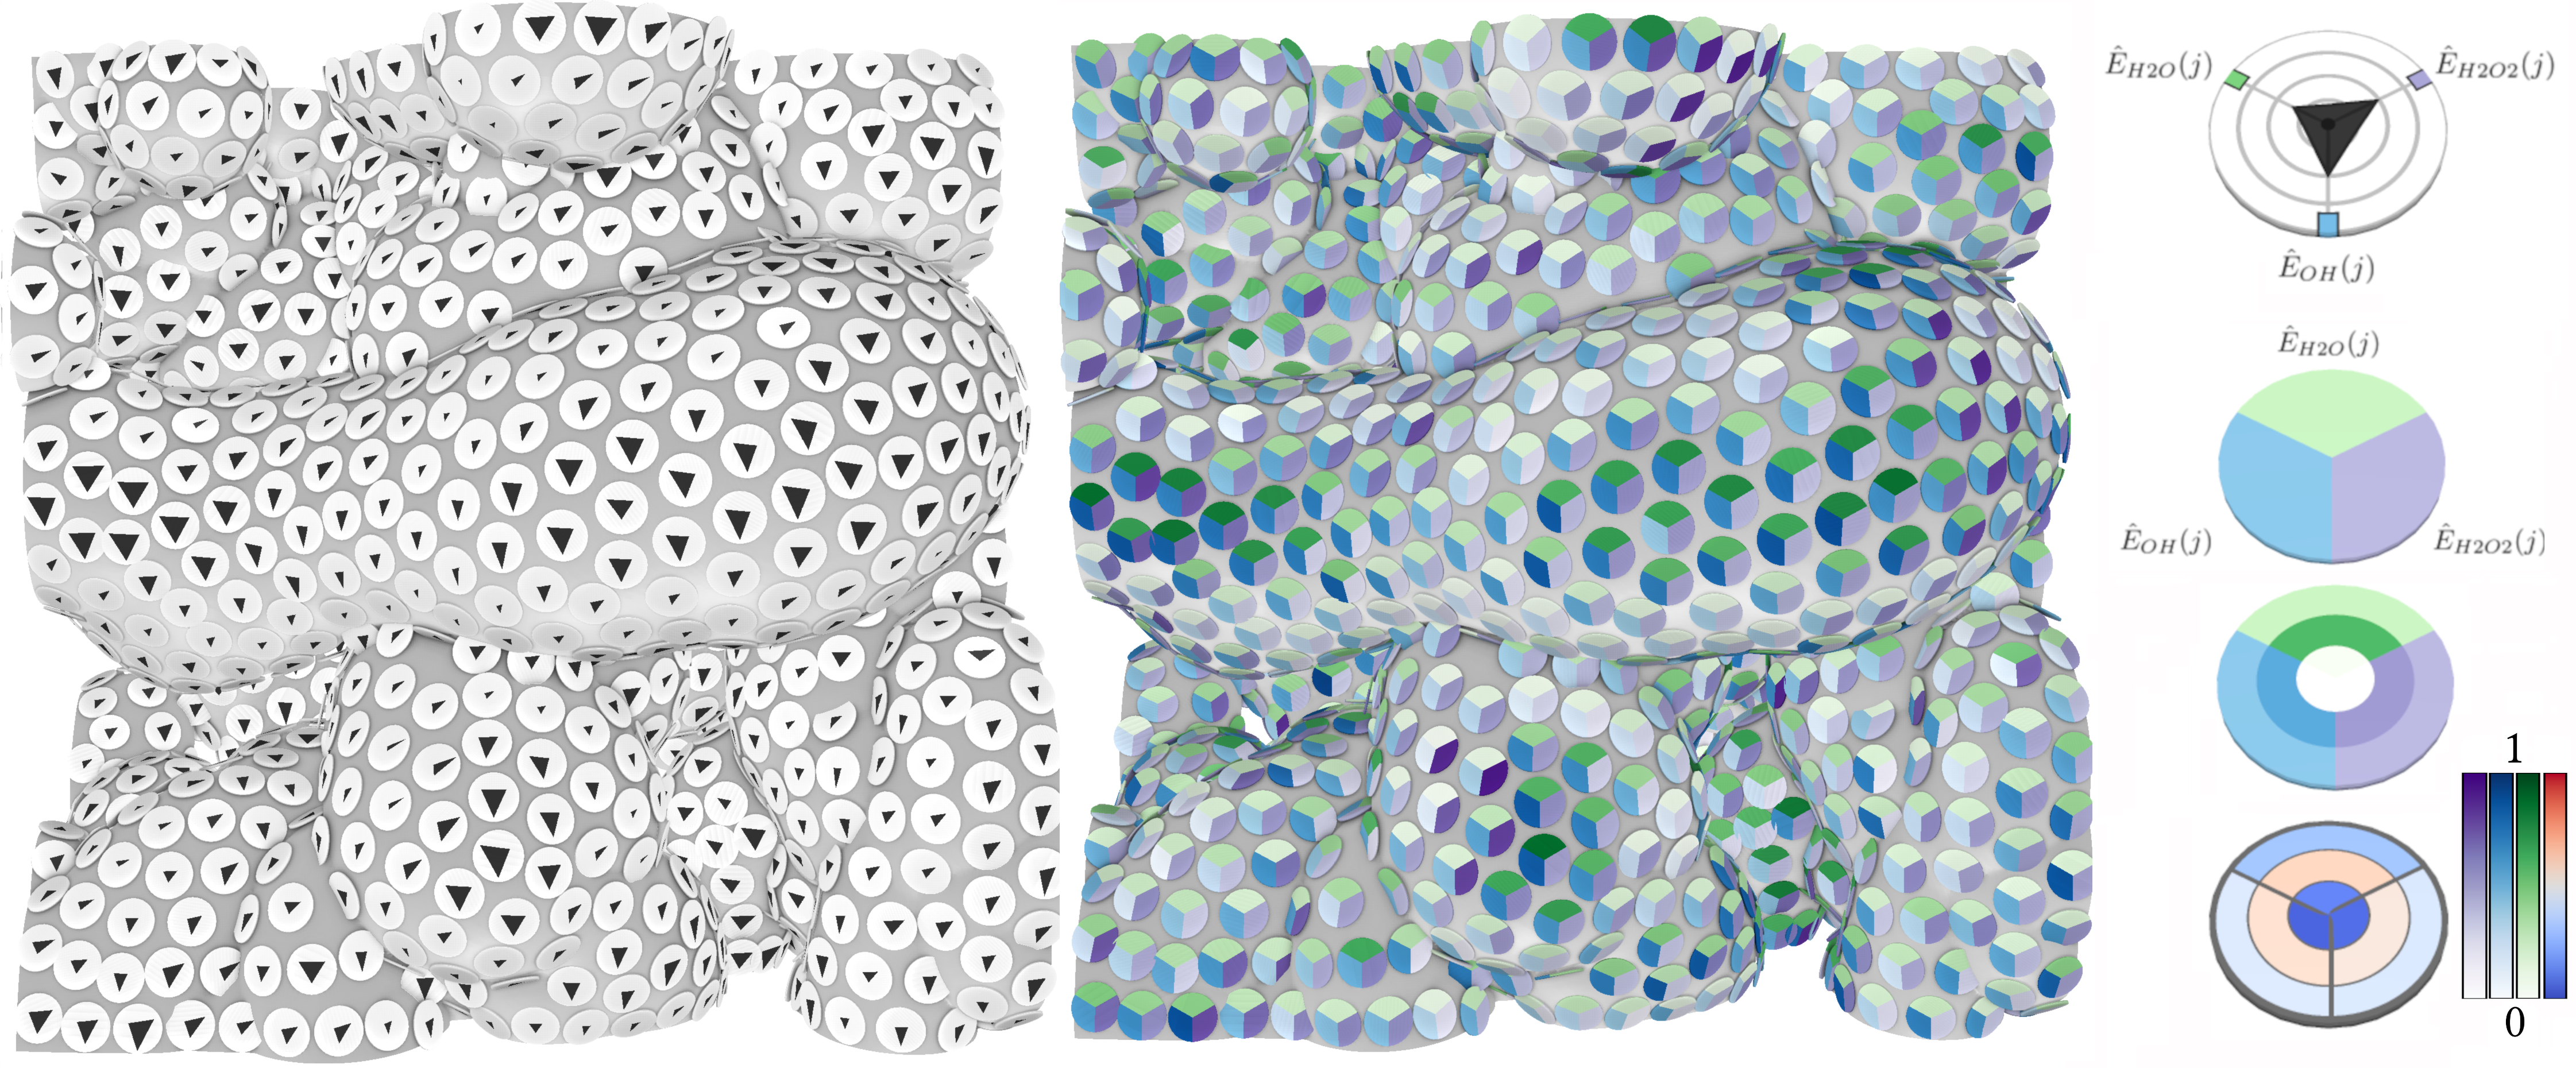
Figure 1. Fields $X_i$ are input to the scale decomposition, and surface features are input to the LSRCVT. Aggregation of spectral energy is done for each scale of each field based on the LSRCVT regions. Glyphs are generated interactively based on the aggregated data. The top two glyphs show the strength glyph design, the left encoding mean spectral energy for 1 field and 3 scale bins, and the right encoding spectral energy for 5 fields and 3 scale bins. The one below the two shows the starplot glyph encoding 5 fields and 1 scale bin.
Many scientific and engineering problems involving multi-physics span a wide range of scales. Understanding the interactions across these scales is essential for fully comprehending such complex problems. However, visualizing multivariate, multiscale data within an integrated view where correlations across space, scales, and fields are easily perceived remains challenging. To address this, we introduce a novel local spatial statistical visualization of flow fields across multiple fields and turbulence scales. Our method leverages the curvelet transform for scale decomposition of fields of interest, a level-set-restricted centroidal Voronoi tessellation to partition the spatial domain into local regions for statistical aggregation, and a set of glyph designs that combines information across scales and fields into a single, or reduced set of perceivable visual representations. Each glyph represents data aggregated within a Voronoi region and is positioned at the Voronoi site for direct visualization in a 3D view centered around flow features of interest. We implement and integrate our method into an interactive visualization system where the glyph-based technique operates in tandem with linked 3D spatial views and 2D statistical views, supporting a holistic analysis. We demonstrate with case studies visualizing turbulent combustion data–multi-scalar compressible flows–and turbulent incompressible channel flow data. This new capability enables scientists to better understand the interactions between multiple fields and length scales in turbulent flows.
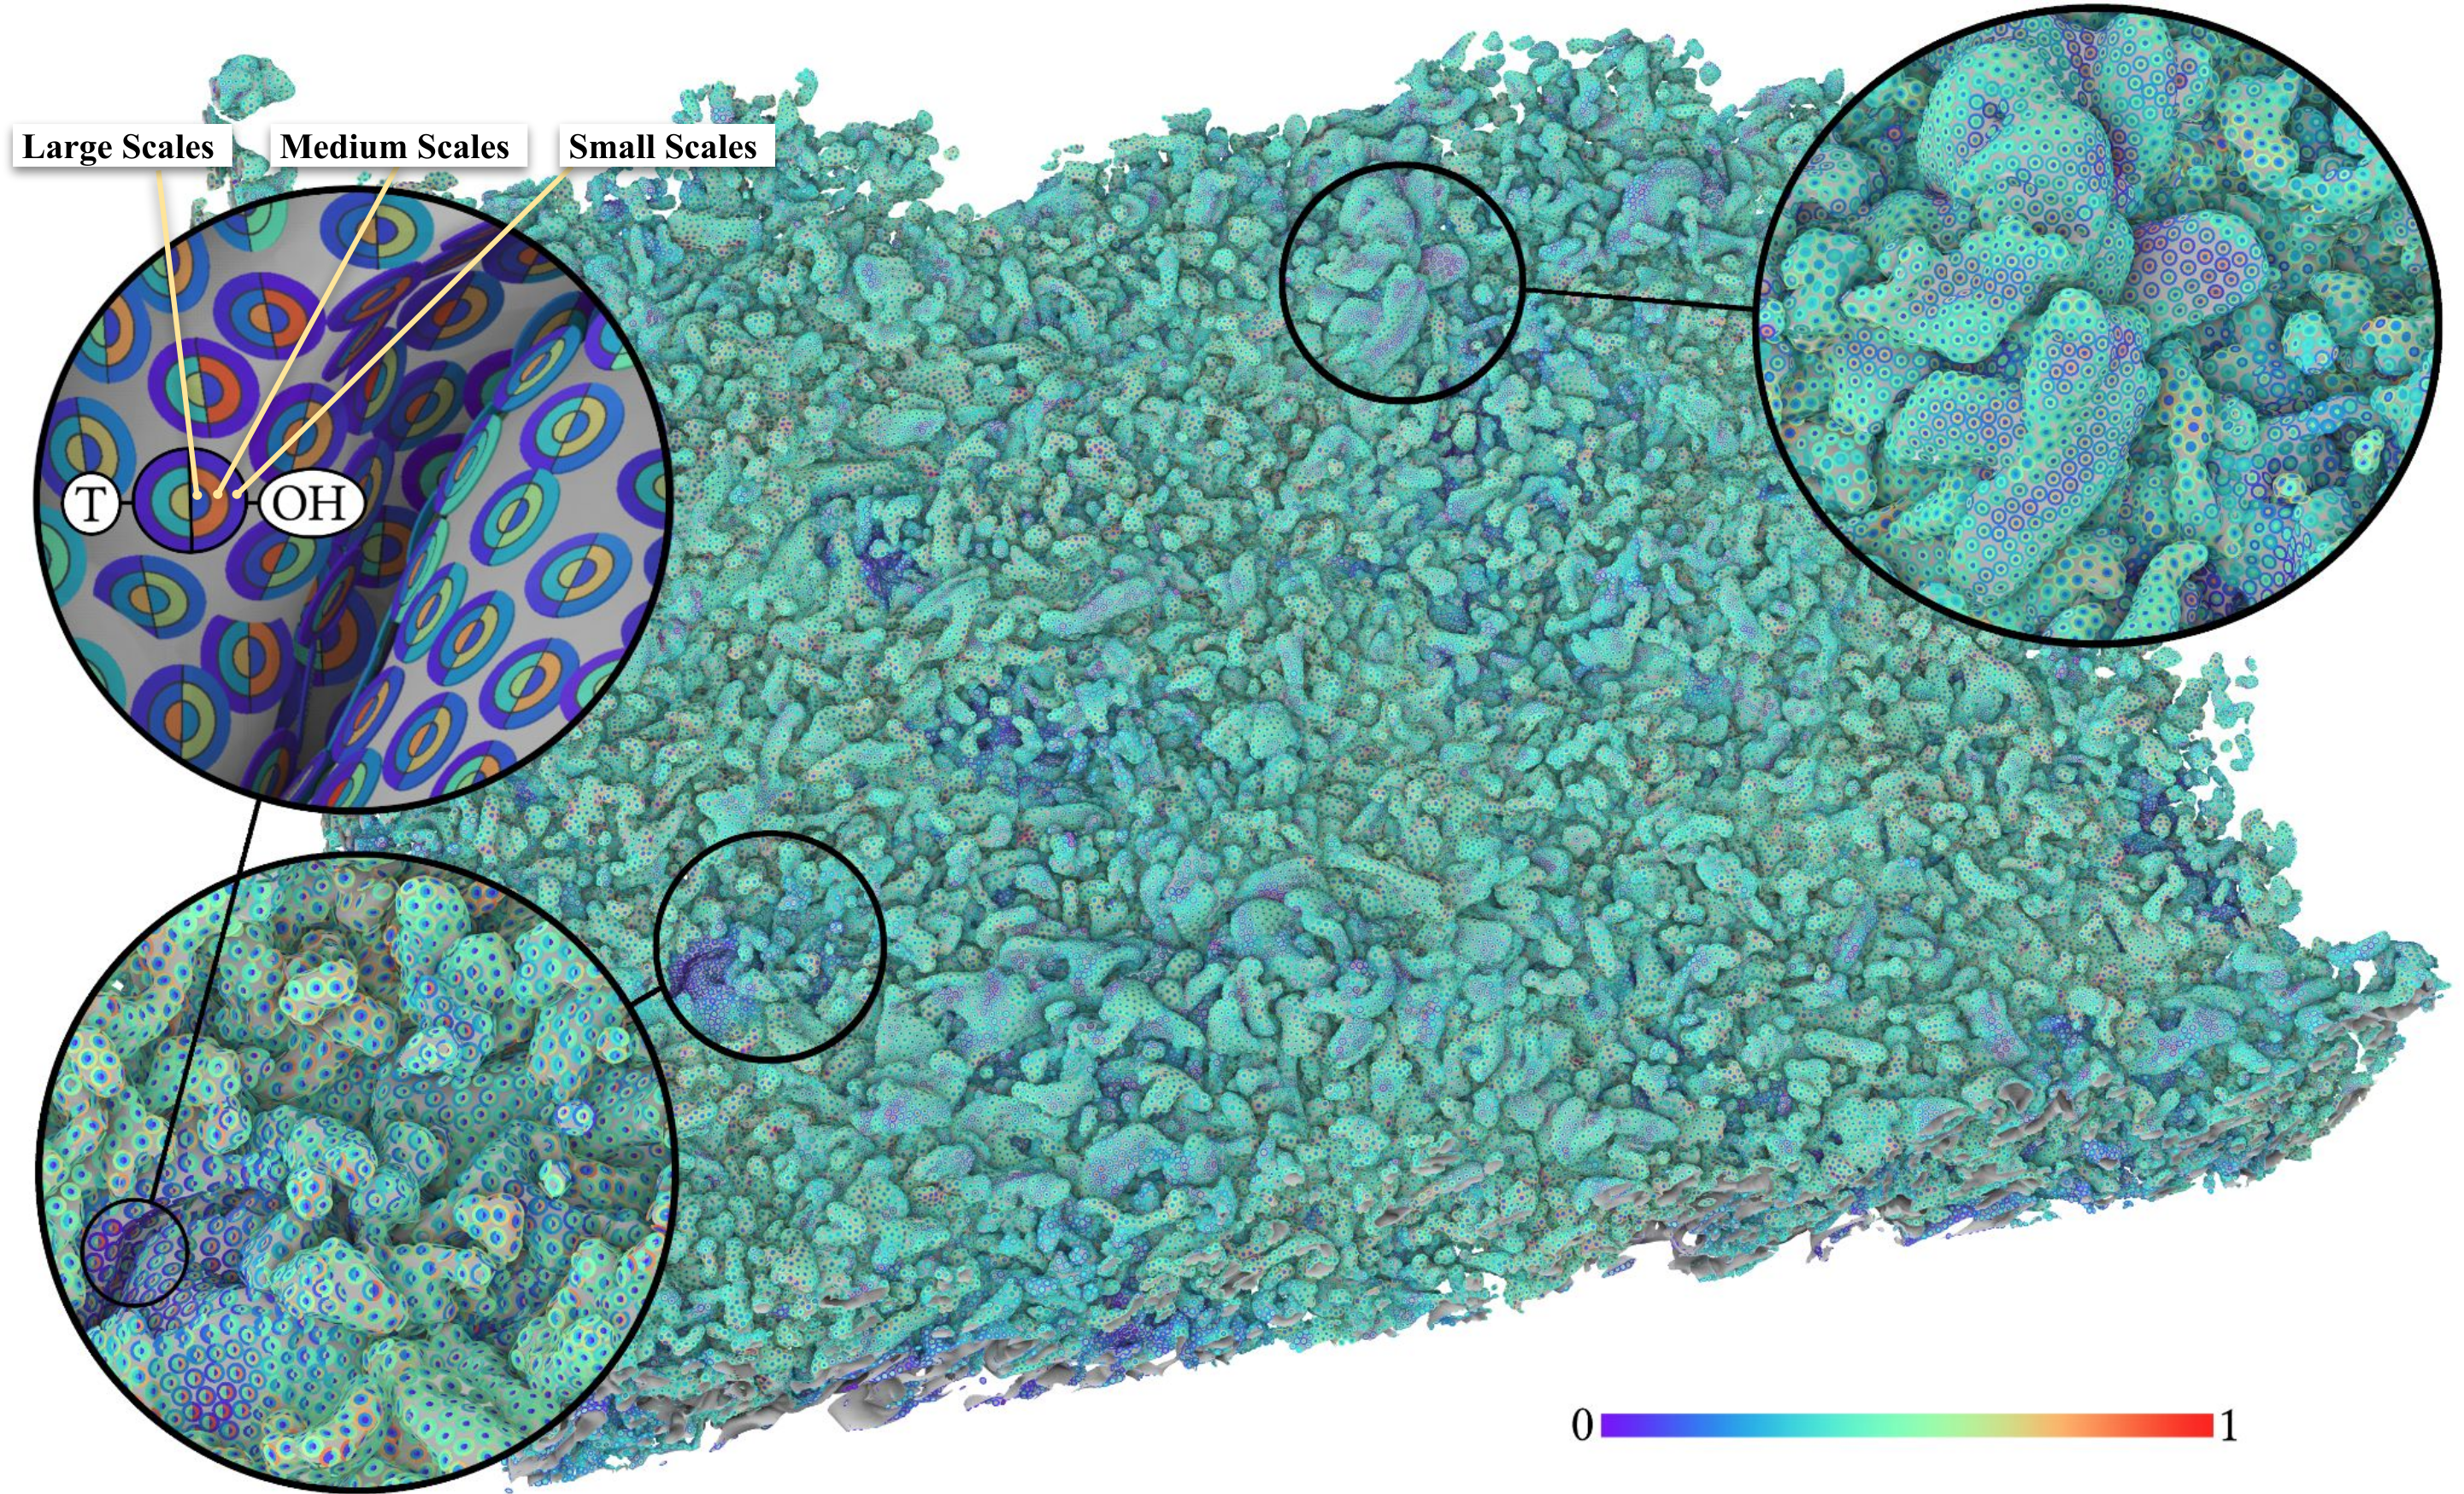
Figure 5. The two views on the left show the same information, spectral energy contribution of the highest frequencies for 3 variables, using the starplot glyph (left) and strength glyph (right). The user can interactively switch between the two glyph types. The top two glyphs on the right show averages over all glyphs. While color-based encoding makes it easy to see variation from afar, a user’s perceptual mapping between colors to values can be more complex or error-prone since it requires referencing color legends, and depends on the user’s perception of color. Distance-based value encoding tends to be perceived more intuitively and precisely. The bottom two glyphs on the right show mean spectral energy for 3 variables and 3 scale bins. Using separate color maps for each variable makes it easier to tell different variables apart at a glance, but makes comparing values across variables more difficult. The bottom right glyph uses the same color map for all 3 variables to make comparison easier.Figure 8. Radial glyph rendering with 3 scale bins for temperature in the combustion data. Left zoom: glyphs are configured to show temperature and hydroxyl radical (OH) together (left side and right side of glyph respectively). In some areas, the balance of scale contributions is very similar between the fields, while in other areas we see a major difference, e.g., the purple area where the medium scales are very dominant for OH compared to temperature. The zoomed-in regions are sized to give a sense of what the visualization might look like fully zoomed out on a high-resolution monitor. While the visibility of the glyphs from afar can be limited depending on the coarseness and size of the glyphs, patterns can still be perceived throughout and zoomed in on to see more precise detail.